data wrangling shootout
Say I have a CSV with two columns:
country, users
China, 113
Nicaragua, 29
Jordan, 89
and I want to aggregate these by continent. What's an easy way to do that?
Well I found this country-by-continent dataset by samayo:
[
  {
    "Country": "Afghanistan",
    "Continent": "Asia"
  },
  {
    "Country": "Albania",
    "Continent": "Europe"
  }
So I have everything I need except for a workflow. Let's evaluate some options.
ChatGPT
I attached the two files and submitted the following prompt to ChatGPT 4o:
I have a CSV of users from each country, and a JSON file that shows which continent each country belongs to.
I would like to aggregate my users by continent, so that I can see how many users I have in total from North America, Europe, etc.
It started working on the problem immediately:
import pandas as pd

users_df = pd.read_csv('/mnt/data/users.csv')
continent_data = pd.read_json('/mnt/data/cbc.json')
To aggregate the users by continent, I'll merge the users dataframe with the continent data based on the country and then group by the continent to get the total users for each continent.
Here is the plan:
Merge the users_df with continent_data on the country.
Group the merged data by the continent.
Aggregate the user counts.
Let's execute this.
merged_df = users_df.merge(
  continent_data,
  left_on='Country',
  right_on='country',
  how='left'
)

aggregated_users_by_continent = merged_df
  .groupby('continent')['Users']
  .sum()
  .reset_index()

import ace_tools as tools;
tools.display_dataframe_to_user(
  name="Aggregated Users by Continent",
  dataframe=aggregated_users_by_continent
)
Result
continent,Users
Africa,23940
Antarctica,833
Asia,18976
Europe,22472
America,13256
Oceania,10539
South America,5300
So, if these values are correct, I'm almost certain there won't be an easier or more convenient workflow.
But that "if" is very ominous to me. How will I be able to verify its correctness once I've deskilled myself by outsourcing all of my Human Intelligence Tasks?
nushell
nushell is a shell environment that converts all stdout into structured data that can then be piped much more consistently like a functional programming language.
ls ~/Desktop | where size > 1MiB | get name
╭───┬───────────────────────────────────────────╮
│ 0 │ /Users/ikesau/Desktop/song.wav            │
│ 1 │ /Users/ikesau/Desktop/ttrpg.pdf           │
╰───┴───────────────────────────────────────────╯
I love it. It balances accessibility with extensibility in a way that inspires me to understand information. I make fewer assumptions about data now that nushell makes it easy (and fun!) to examine things rigourously.
How does it handle an aggregation though? First I need to load the two tables:
let $c = nopen1 country-by-continent.json
let $u = nopen users.csv
these now exist in my session's scope:
$c
╭─────┬─────────────────────┬───────────────╮
│   # │      country        │   continent   │
├─────┼─────────────────────┼───────────────┤
│   0 │ Afghanistan         │ Asia          │
│   1 │ Albania             │ Europe        │
│   2 │ Algeria             │ Africa        │
Now we can join them on Country-country2 and group them:
$u
| join --left $c Country country
| group-by --to-table continent
| each3 {
  insert sum4 {
    get items.Users | math sum5
  }
  | select group sum6
}
Result
╭───┬───────────────┬───────╮
│ # │     group     │  sum  │
├───┼───────────────┼───────┤
│ 0 │ Asia          │ 18976 │
│ 1 │ Europe        │ 22472 │
│ 2 │ Africa        │ 23940 │
│ 3 │ Oceania       │ 10539 │
│ 4 │ North America │ 13256 │
│ 5 │ Antarctica    │   833 │
│ 6 │ South America │  5300 │
╰───┴───────────────┴───────╯
Okay, not bad. Working out how to sum nested values after grouping them took
ages - a lot of describe and reading the docs on which
data types are compatible with which functions.7
I think with a bit more practice, I would get a lot faster at writing the pipes correctly, but I'm not a huge fan of polluting my shell history with dozens of failed attempts in the meantime, and editing commands in the terminal is a pain.
nushell with polars
It's worth mentioning that nushell also has a polars plugin which feels like a great tool for the job.8 This is a popular usecase for dataframes so finding the correct syntax was simple.
$u
| join --left $c Country country
| polars into-df
| polars group-by continent
| polars agg [(polars col Users | polars sum)]
| polars collect
Result
╭───┬───────────────┬───────────────╮
│ # │   continent   │     Users     │
├───┼───────────────┼───────────────┤
│ 0 │ Antarctica    │           833 │
│ 1 │ South America │          5300 │
│ 2 │ Europe        │         22472 │
│ 3 │ Africa        │         23940 │
│ 4 │ Asia          │         18976 │
│ 5 │ Oceania       │         10539 │
│ 6 │               │         19175 │
│ 7 │ North America │         13256 │
╰───┴───────────────┴───────────────╯
Aha! I was wondering if any of these methods would show the cases where we can't map the country to a continent - presumably that's what that 19175 is - despite the left join in the vanilla nushell method, it didn't catch this issue.
So while we're here, let's see if we can list which countries aren't being mapped. I don't think we need a dataframe for this.
$u
| join --left $c Country country
| where continent == null
| get Country9
| to text
Türkiye
Taiwan
Czechia
Libya
Myanmar (Burma)
Trinidad & Tobago
Bosnia & Herzegovina
Côte d’Ivoire
Kosovo
Fiji
Congo - Kinshasa
Eswatini
Isle of Man
Réunion
Jersey
Guernsey
British Virgin Islands
Curaçao
(not set)
St. Kitts & Nevis
Timor-Leste
Sint Maarten
Congo - Brazzaville
St. Helena
Turks & Caicos Islands
St. Vincent & Grenadines
Antigua & Barbuda
St. Lucia
U.S. Virgin Islands
São Tomé & Príncipe
Falkland Islands (Islas Malvinas)
Caribbean Netherlands
Micronesia
Åland Islands
St. Martin
St. Pierre & Miquelon
Vatican City
St. Barthélemy
Svalbard & Jan Mayen
U.S. Outlying Islands
Wallis & Futuna
There are some very populous countries here! This is exactly the sort of problem with relying on ChatGPT: your ability to trust it depends on your ability to verify it, which is only developed through experience.
DuckDB
DuckDB is a portable SQL database client. You can run it as a transient SQL session, or use it as an engine to run SQL scripts. I went with the latter because I prefer to write SQL in a text editor.
Here's my scratch.sql file leveraging some cool DuckDB magic that
can work with inline references to CSV and JSON files, which I can run with
cat scratch.sql | duckdb10
SELECT
    SUM(u.Users),
    c.continent
FROM
    'users.csv' u
    LEFT JOIN 'country-by-continent.json' c
    ON u.Country = c.country
GROUP BY
    c.continent;
Result
┌───────────────┬──────────────┐
│   continent   │ sum(u.Users) │
│    varchar    │    int128    │
├───────────────┼──────────────┤
│ Europe        │        22472 │
│ South America │         5300 │
│ Antarctica    │          833 │
│ Oceania       │        10539 │
│ North America │        13256 │
│ Africa        │        23940 │
│ Asia          │        18976 │
│               │        19175 │
└───────────────┴──────────────┘
This is about as easy as it can get, and I like that it's basically just plain SQL, which is never a waste of time to practise.
Observable
Observable is a JavaScript notebook platform with a host of features for interatively visualizing and sharing data. There are a dozen ways I could do this aggregation with Observable, including creating whole databases, but I'm going to go with the most straightforward: attaching files and writing some code.
Here's a link to the notebook.
The gist of the workflow was:
- Upload the files to the notebook
- Merge them with JavaScript
- Use Observable's SQL cell to write an aggregating SQL query on the merged data
- Visualize the aggregated data (an optional nicety)
Result
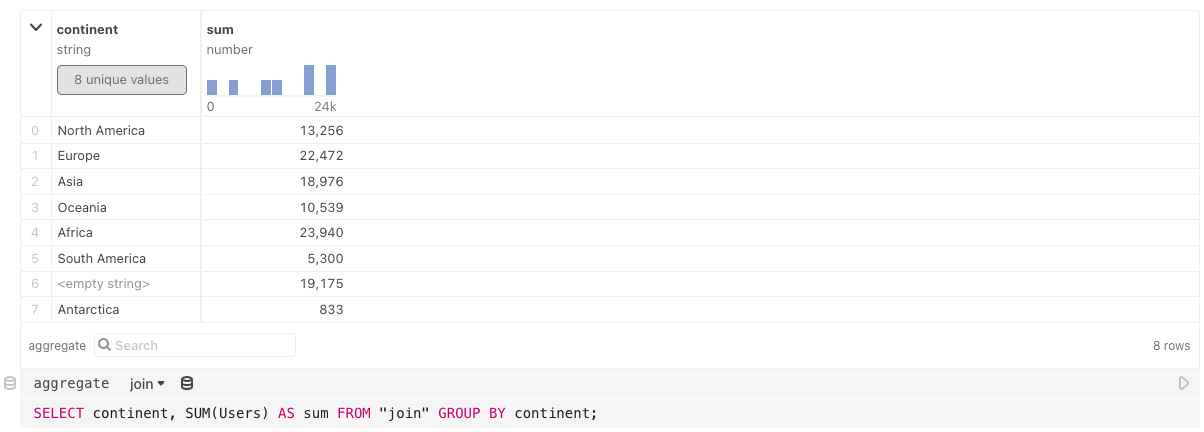
Unfortunately, as far as I can tell, Observable's SQL cell doesn't allow you to query from two tables at once11, so either you have to join your tables before you upload them, or join them with JavaScript and query that third object.
It's all quite a lot of process for answering simple questions, but it makes sharing your findings (and visualizing them) incredibly easy. Simon Wilson (the creator of datasette) uses notebooks all the time to create quick, low-friction tools. While I might not reach for them for the next question as simple as this, I really like Observable as a platform and I hope they're able to keep doing what they're doing.
At this point, the only reason I'd consider reaching for another tool is to keep it local and/or to have Copilot support.
TypeScript with Bun
Bun allows me to run a TypeScript REPL incredibly quickly. All I have to do is create an `index.ts` file somewhere.
bun run --watch index.ts
Now in my Copilot-supporting text editor of choice I can write up a quick script in TypeScript.
import fs from "fs/promises"
import { parse } from "csv-parse"

async function main() {
  const csv: { Country: string; Users: string }[] = await fs
    .readFile("users.csv", "utf-8")
    .then((data) => parse(data, { columns: true, cast: true }).toArray());

  const json = await fs
    .readFile("country-by-continent.json", "utf-8")
    .then(JSON.parse)
    .then((countries: { country: string; continent: string }[]) =>
      countries.reduce((acc, country) => {
        acc[country.country] = country.continent;
        return acc;
      }, {} as { [country: string]: string })
    );

  const byContinent = csv.reduce((acc, { Country, Users }) => {
    const continent = json[Country];
    acc[continent] = (acc[continent] || 0) + parseInt(Users);
    return acc;
  }, {} as Record>string, number<);

  console.log("byContinent", byContinent);
}

main();
Result
byContinent {
  "North America": 13256,
  Europe: 22472,
  Asia: 18976,
  Oceania: 10539,
  Africa: 23940,
  "South America": 5300,
  unknown: 19175,
  Antarctica: 833
}
I thought this option was going to be more pleasant! Even with Copilot, a code editor, and a CSV parsing library, manually implementing a grouping algorithm is a chore.
Still. When I need a REPL to test code with, using bun this way is very good.
Conclusion
I think DuckDB wins? Each technique has its strengths, but writing SQL with Copilot, with automatic JSON/CSV handling is about as practical and quick as it gets.